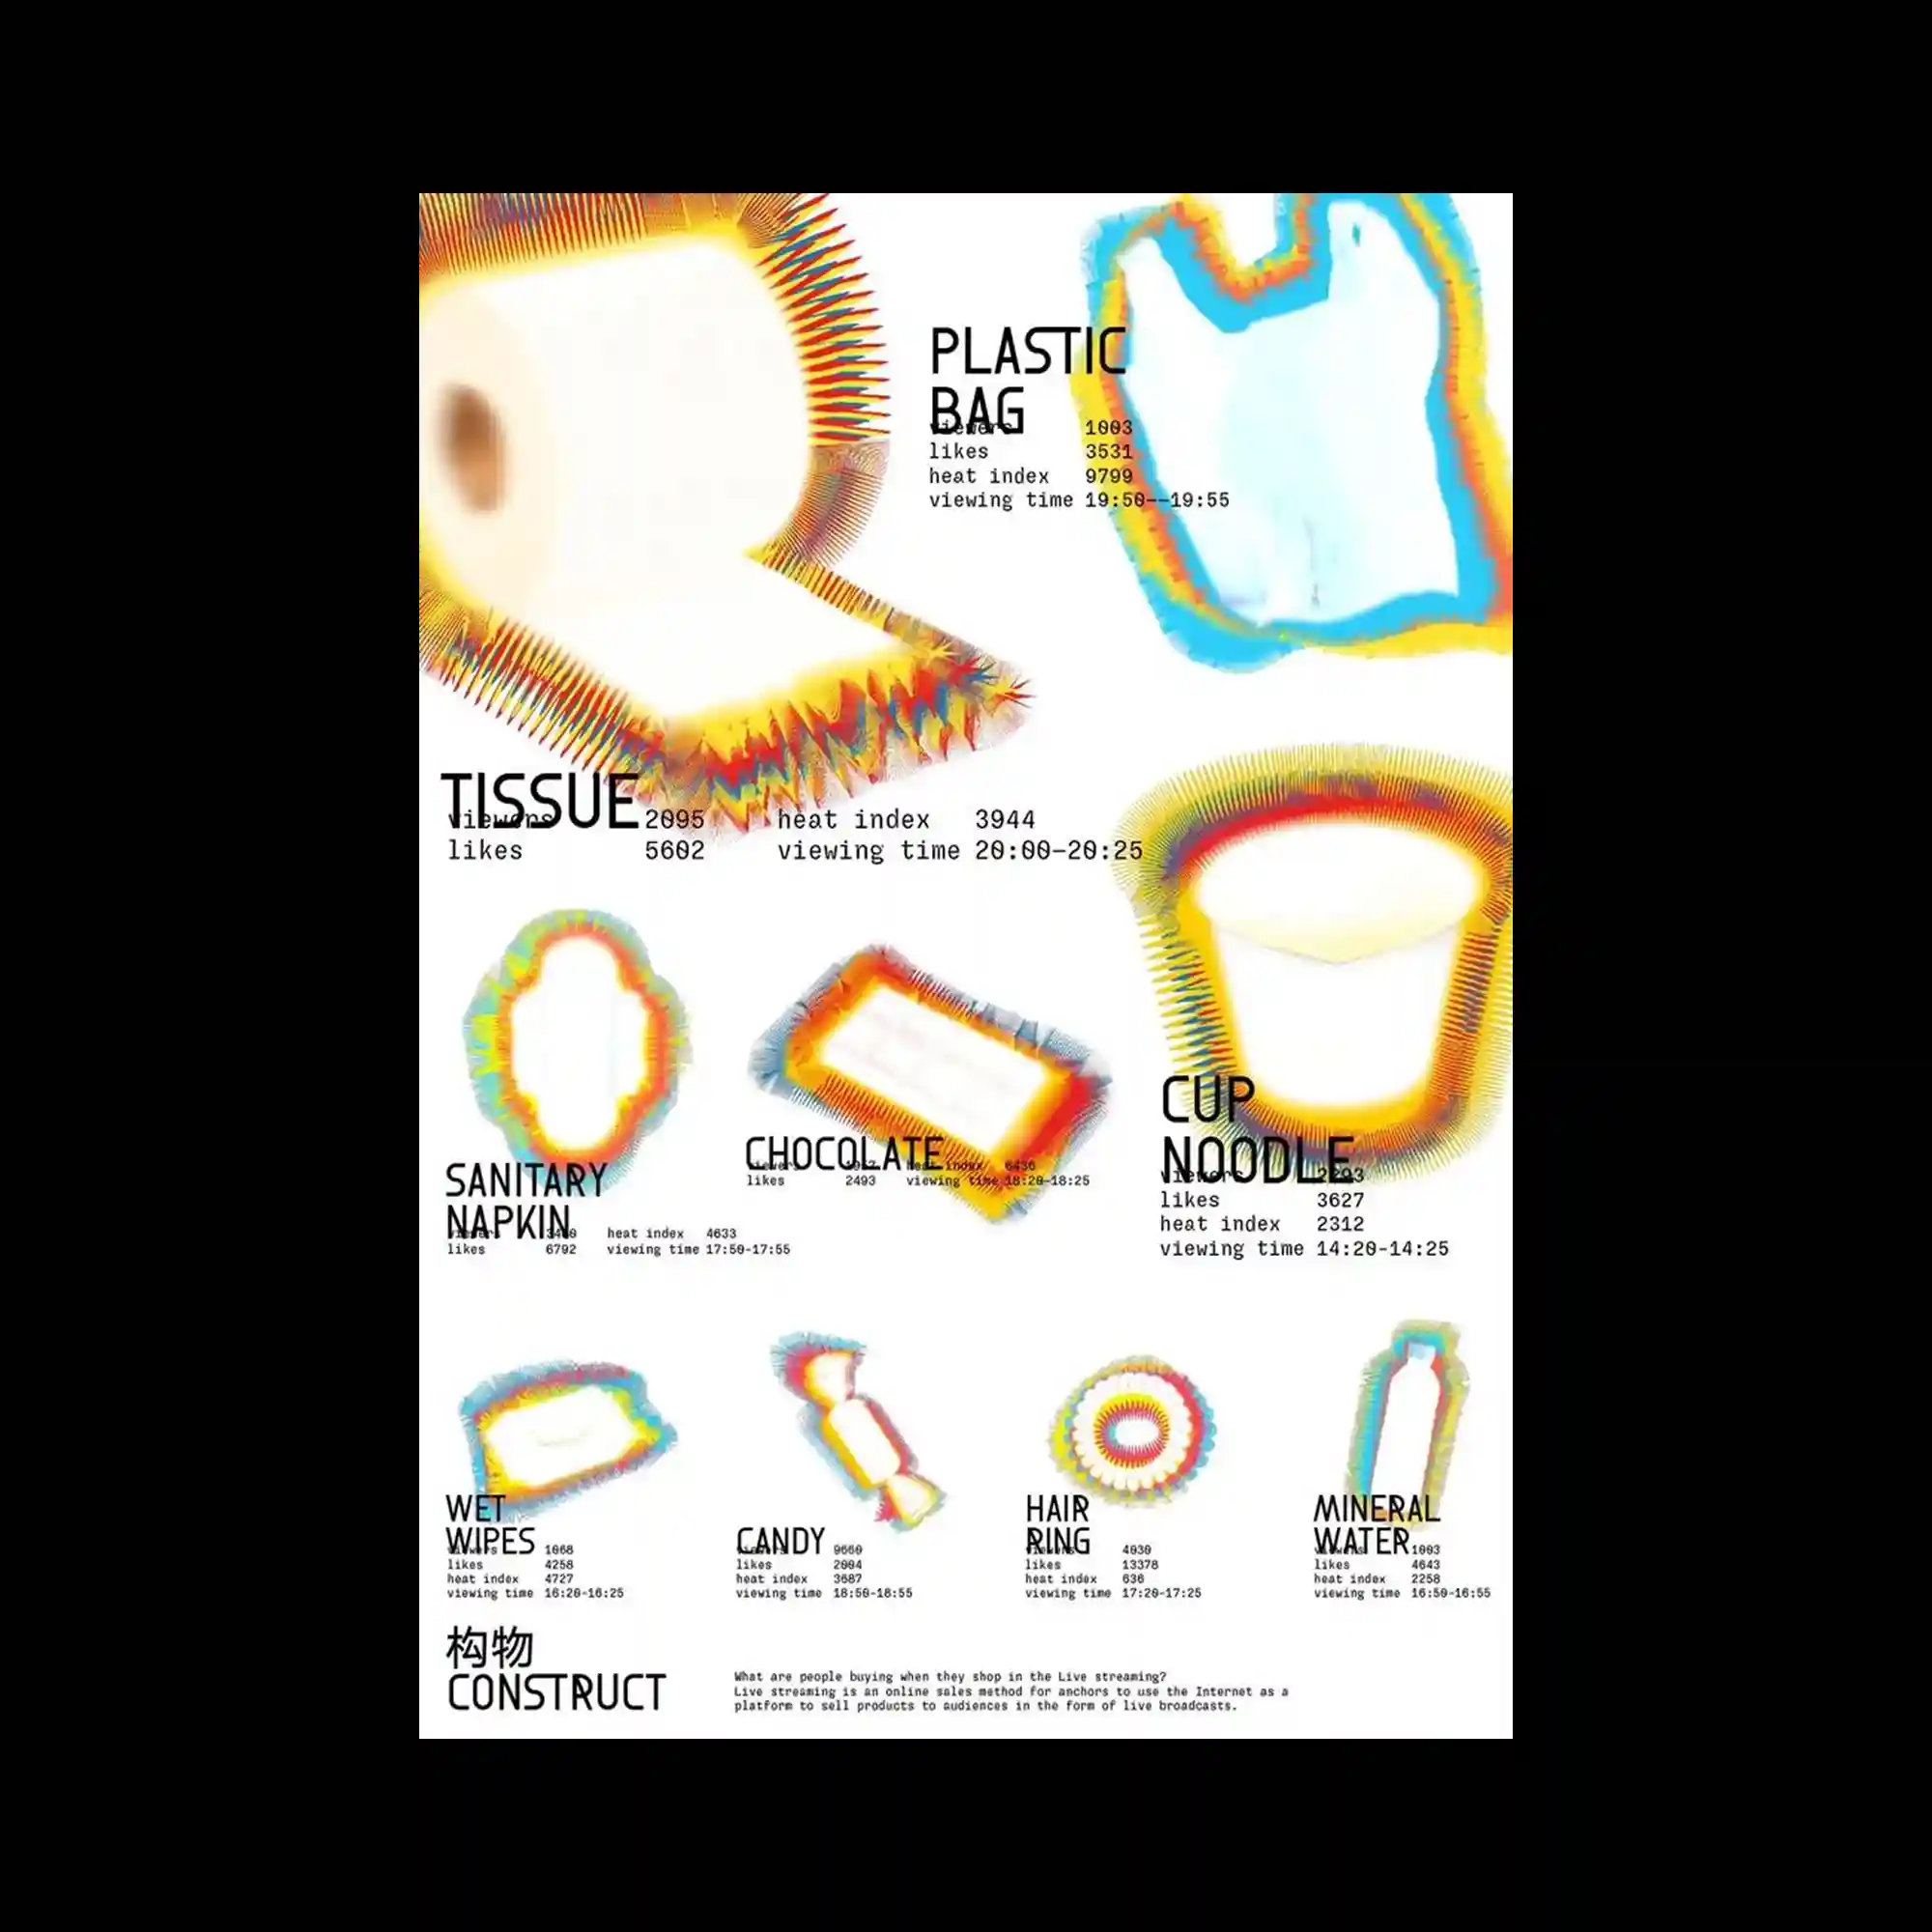
Poster visualizing consumer product categories like “tissue,” “plastic bag,” and “cup noodle” with heatmap-style gradients and statistics about likes and viewing times.
“휴지”, “비닐봉지”, “컵라면” 등 소비재를 열지도로 표현하고 좋아요 수와 시청 시간 등의 데이터를 함께 시각화한 포스터.
用热度图渐变展示“纸巾”、“塑料袋”、“泡面”等消费品,并附上点赞量与观看时间数据。